The quest to map the mouse brain

By combining single-cell sequencing with methods to map the spatial location of gene expression, scientists are unravelling the extraordinary cellular diversity of the brain
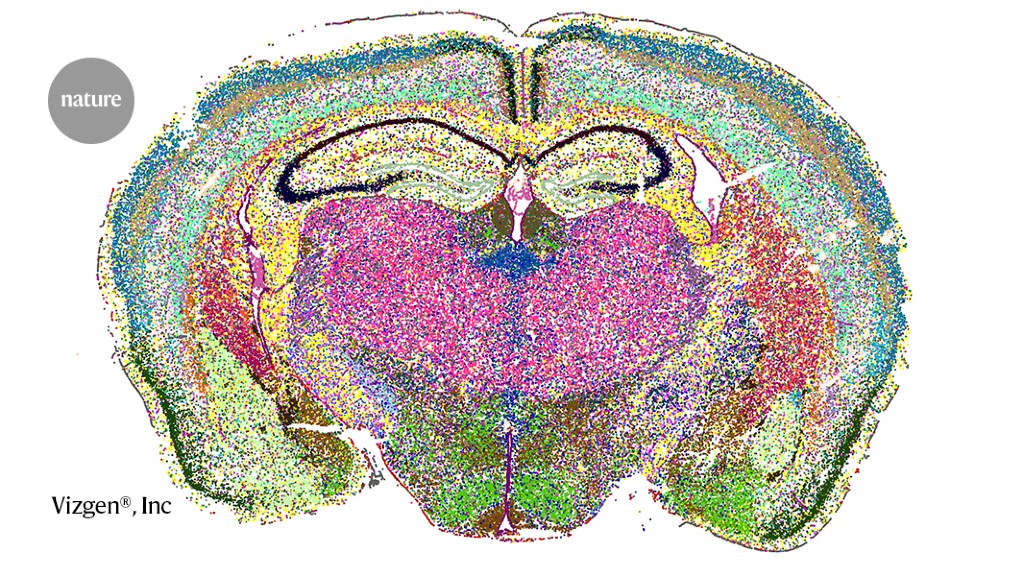
Cell clusters in a section of the mouse brain, imaged using a spatial-transcriptomics technique called MERFISH.Credit: Vizgen
Santiago Ramón y Cajal revolutionized neurobiology in the late nineteenth century with his exquisitely detailed illustrations of neural tissues. Created through years of meticulous microscopy work, the Spanish physician-scientist’s drawings revealed the unique cellular morphology of the brain.
“With Cajal’s work, we saw that the cells of the brain don’t look like the cells of every other part of the body — they have incredible morphologies that you just don’t see elsewhere,” says Evan Macosko, a neuroscientist at the Broad Institute of MIT and Harvard in Cambridge, Massachusetts.
Ramón y Cajal’s drawings provided one of the first clues that the keys to understanding how the brain governs its many functions, from regulating blood pressure and sleep to controlling cognition and mood, might lie at the cellular level.
Still, when it comes it comes to the brain, crucial information remained — and indeed, remains — missing. “In order to have a fundamental understanding of the brain, we really need to know how many different types of cells there are, how are they organized, and how they interact with each other,” says Xiaowei Zhuang, a biophysicist at Harvard University in Cambridge.
What neuroscientists require, Zhuang explains, is a way to systematically identify and map the many categories of brain cells. Now researchers are closing in on such a resource, at least in mice. By combining high-throughput single-cell RNA sequencing with spatial transcriptomics — methods for determining which genes are expressed in individual cells, and where those cells are located — they are creating some of the most comprehensive atlases of the mouse brain so far. The crucial next steps will be working out what these molecularly defined cell types do, and bringing the various brain maps together to create a unified resource that the broader neuroscience community can use.
Mapping the brain
Mice are remarkably powerful as an experimental platform, because they allow neuroscientists to probe the brain in ways that are impossible in humans. Tools such as optogenetics — a technique in which animals are genetically modified so that scientists can control their cellular activity with light — provide ways to test how specific neurons influence behaviour, but such manipulation is impractical and unethical in humans.
Single-cell brain atlases that define cells by their gene-expression profiles can bridge the two species, says Sten Linnarsson, a neuroscientist at the Karolinska Institute in Stockholm. A researcher interested in a particular cell type in humans, for instance, could use gene-expression patterns to find that same cell type in a mouse and manipulate those cells instead. Gene expression also provides researchers with a more nuanced way of classifying brain cells, a task that has typically relied on coarser characteristics, such as physical structure, location, connections and firing patterns.
Linnarsson and others have used single-cell RNA sequencing to create this kind of comprehensive map. Early studies focused on specific brain regions, such as the cerebral cortex — the outer layer of the brain. Then, in 2018, two groups extended this technique to the whole brain. One study, by Linnarsson’s team, analysed nearly half a million cells in the mouse brain, spinal cord and peripheral nervous system. Using computer algorithms to classify cells on the basis of their patterns of gene expression, the team identified 265 “clusters”, each of which represents a distinct, molecularly defined, cell type1. The other study, by a team at Harvard Medical School and the Broad Institute, including Macosko, identified 565 cell clusters among 690,000 cells in the mouse brain2.
Those clusters included cell types never previously reported. Linnarsson’s study, for example, revealed seven varieties of astrocyte, non-neuronal cells that perform a range of functions, from providing neurons with energy to maintaining neuronal connections. Previously, scientists had recognized just four major classes of astrocyte1.
But it’s one thing to know that a cell type exists, and quite another to know where it is. “What was missing in both papers was a spatial component,” says Macosko.
Researchers needed a way to identify not only which genes are expressed in each cell, but precisely where in the brain those cells are. That’s where spatial transcriptomics comes in.
Charting cellular diversity
In 2015, Zhuang and her team debuted a spatial-transcriptomics technique dubbed multiplexed error-robust fluorescence in situ hybridization (MERFISH)3. It works by assigning a barcode — a unique sequence of DNA probes — to each RNA species, and then systematically decoding these barcodes over several rounds of microscopy imaging. The barcodes are ‘error-robust’ in that the sequences are built to withstand a certain number of misreads before they can be mistaken for another barcode.
After demonstrating that MERFISH could resolve more than 1,000 genes concurrently in cultured human cells, the researchers turned to the mouse brain, building atlases of specific regions and comparing cellular organization in mice and humans4. Among other things, they found that parts of the human cerebral cortex had a greater proportion of glia (a group of non-neuronal cells that include astrocytes and microglia, the brain’s resident immune cells) than did comparable regions in mice, and that there were more interactions between neural and non-neuronal cells in the human cerebral cortex than in the mouse.
Now, Zhuang and her colleagues have taken MERFISH to the whole-brain level. Applying the technique to some eight million cells from adult mouse brains and integrating those data with single-cell RNA sequencing data for the same cells, the team documented more than 5,000 cell clusters with distinct transcriptional signatures. The team posted the findings on the bioRxiv preprint server in March5 — one of three such studies to be published in the space of a week.
The second of these studies, led by Hongkui Zeng, director of the Allen Institute for Brain Science in Seattle, Washington, also combined single-cell RNA sequencing with MERFISH6. (Zeng and Zhuang, as well as members of their groups, were involved in both abovementioned studies.) Although the two studies used similar methods, they addressed different questions. The first study emphasized spatial gradients — gradual changes in gene-expression profiles between cell clusters, as well as discrete, molecularly defined brain regions called spatial modules; whereas the second focused on DNA-binding proteins called transcription factors in defining different cell types. “We’ve just touched the surface,” Zhuang says. “This data set provides rich insights into the molecular and cellular architecture of the brain — and provides a valuable resource for future investigations.”
The third study, by Macosko and his colleagues, used a different spatial approach7. Rather than MERFISH, which relies on microscopy, Macosko used a sequencing method called Slide-seq. The technique effectively transfers cellular RNA from a tissue sample to a surface that is studded with barcoded microbeads. Since each bead is at a known location, researchers can use the barcodes to determine where in the tissue the associated RNAs are located. By combining that approach with single-nucleus RNA sequencing, which reports gene transcripts from the nucleus rather than the entire cell, Macosko and his team created their own mouse-brain atlas.

Fluorescent micrograph of a section through the cerebellum.Credit: Thomas Deerinck, NCMIR/SPL
All three studies were at least partially funded by the US National Institutes of Health BRAIN Initiative Cell Census Network (BICCN), which supports laboratories that are working to create comprehensive maps of cells in the brains of mice and primates, including humans. And all three converged on a similar message: the mouse brain has extraordinary cellular diversity, a big chunk of which is found outside the cortex. The cortex, the teams found, had fewer cell types with more-distinct transcriptional signatures, whereas regions such as the hypothalamus, midbrain and hindbrain, all of which are located near the base of the brain, had many more cell types that were similar to one another.
This difference might reflect the different evolutionary histories of these regions, Zeng speculates. Regions such as the hypothalamus, midbrain and hindbrain are largely responsible for crucial physiological functions, such as feeding, metabolism and movement, that are conserved across animals, and might thus house hardwired, highly specific cell types that remain largely unchanged over time. But in the cortex, which controls higher-level cognitive functions that can adapt to changing environments, cells might have been able to diverge from one another more rapidly.
Macosko’s data are publicly available at braincelldata.org; data from the other two studies are available at brainimagelibrary.org; and the Allen Institute plans to launch an interactive website later this year, according to Zhuang.
“These are absolutely beautiful studies,” says Konstantinos Meletis, a neuroscientist at the Karolinska. “They show that it’s possible now to use large-scale, targeted approaches to understand the spatial organization of hundreds of genes simultaneously.” Meletis and his colleagues published their own whole-mouse-brain atlas three years ago and used a different spatial transcriptomics approach8. (That study didn’t map the whole brain at the single-cell level, but the team demonstrated — in certain regions — that its technique could be combined with single-cell RNA sequencing to reach cellular resolution.)
Beyond gene expression
Single-cell gene-expression atlases are invaluable resources for the neuroscience community, Zeng says. The ability to pinpoint a specific cell type from its molecular signature enables neuroscientists to develop tools to study the functions of these cells in the healthy brain — and in the context of disease.
But those aren’t the only types of atlases researchers are building.
Bing Ren, a molecular geneticist at the University of California, San Diego, joined forces with Joe Ecker, a molecular biologist at the Salk Institute in La Jolla, California, to map the epigenetic landscape of the mouse brain. Ecker’s lab had developed a method to examine DNA methylation — chemical modifications to DNA that can alter gene expression — across the entire genome of individual cells, and Ren’s group had devised a technique to analyse the landscape of accessible regions of chromosomes, which mark areas of active gene expression and regulation. “We thought by defining the epigenome in different cell types, we could have an alternative approach to defining cell identity,” Ren says. This method enabled the team to both identify different brain cells and determine the mechanism of gene regulation in each cell type more comprehensively, he adds.
Combining these techniques and applying them across the mouse brain, Ren, Ecker and their colleagues identified more than 4,000 cell clusters. The team posted its study — which was also part of the BICCN — on bioRxiv in April, reporting that the cell types they found largely line up with those identified using spatial transcriptomics9.
Meanwhile in Shanghai, China, Jun Yan, a neuroscientist at the Chinese Academy of Sciences’ Institute of Neuroscience, and his colleagues have been mapping out the long-range connections between individual neurons across the brain — the ‘projectome’. They developed a computational algorithm that could identify these links by tracing out axons, the long fibres that carry signals away from the body of a nerve cell, for individual neurons in the mouse prefrontal cortex, a brain region that, in humans, is involved in decision-making, emotion and perception, among other things10. The team has since extended its work to include dendrites11, the nerve-cell branches that receive signals, and has set its sights on a projectome of the entire brain.
“The nervous system is a network,” Yan explains, “so the function of the network is derived from connectivity.”
Others are mapping how brains change over time. Yongsoo Kim, a neuroscientist at the Pennsylvania State University in Hershey, is using high-resolution imaging to create 3D atlases of the mouse brain throughout development, starting from the embryonic stage. Currently, Kim says, there is one “truly fantastic” reference for the adult mouse brain — the Allen Mouse Brain Common Coordinate Framework, which was created from high-resolution imaging of more than 1,600 murine brains12. But even this resource represents only a single time point; by creating more ‘common coordinate frameworks’, Kim and his team hope to provide a template for building maps across developmental stages.
From mouse to human
Now researchers are applying these techniques to larger mammals, including humans. Last year, the National Institutes of Health announced US$500 million in funding for the BRAIN Initiative Cell Atlas Network (BICAN), to build a comprehensive map of the human brain.
But the human brain presents significantly greater challenges; for one thing, it contains an estimated thousand-fold more cells than does the mouse brain. Scientists are also limited in the kinds of experiments they can do with human brain tissue — studies must use post-mortem material and contend with the greater variability between humans than lab mice, which often have identical genetic backgrounds and are raised in the same environment.
Still, work on the human brain has already led to fresh insights. In one analysis13, Linnarsson and his colleagues used single-nuclei RNA sequencing to survey three million cells across the human brain. Their study, which was posted on bioRxiv in October 2022, revealed that, as in the mouse, there were many more cell types located in regions such as the midbrain and hindbrain than in the cortex. “In humans, we tend to take a very cortex-centric view of the brain,” Linnarsson says, but these findings indicate that researchers could pay more attention to these other, often overlooked brain areas.
In the meantime, researchers are delving deeper into spatial cell atlases to explore what these newly identified cell types do. Zhuang’s team, for example, looked at the spatial proximity of different cell types and their gene-expression patterns to deduce cell–cell interactions, an important clue to teasing apart the molecular and cellular mechanisms that give rise to different brain functions. And Macosko says that his team has developed an algorithm that can be used to determine the minimum number of genes needed to distinguish one cell type from another — a resource that gives neuroscientists a “recipe book” for their experiments.
Researchers might even be able to mine these atlases for therapies. Existing treatments for psychiatric and neurological diseases tend to leverage coarse-grained cellular specializations — targeting dopamine- or serotonin-specific neurons, for instance. But as these atlases show, there are thousands of cell types in the brain, and in that diversity lies the potential for modulating their behaviour in ways that researchers hadn’t previously considered. “From a therapeutics perspective,” Macosko says, “there’s a huge opportunity here to learn how these different cell types affect cognition, mood, but also physiology.”
Nature 620, 685-687 (2023)
doi: https://doi.org/10.1038/d41586-023-02559-9
This story originally appeared on: Nature - Author:Diana Kwon


